Make gauge charts using Canvas and Javascript
Description
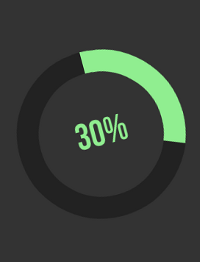
You can make gauge charts using simple arcs in HTML5 canvas. This tutorial walks you through the process of making one.
The gauge chart refreshes every 2 seconds and the numbers increase/decrease in an animation to move towards the new number. During practical use the refreshes could be replaced with AJAX requests on a realtime dashboard.
23 Comments
Description


23 Comments
(close)Aamir Afridi
This is good learning :)
Bhaskar Reddy
Very Nice Tutorial.
rafiks
wow,all that work for just a spinning wheel!
Noext
amazing, thx dud
patvillaruz
hi! can you create a 3 different color canvas?
RastaLoVeLy
Nice trick ! How could i do it one an horizontal line ?
Manny
Nice tutorial. Gave me a starting point to using canvas in animation, though logically in your code, draw should have been init and init draw.
TT
thanks for the great tutorial. do check out a great list of gauges at http://www.fusioncharts.com/demos/gallery/#gauges
Pedro Melendez
awesome tutorial! THANKS!
2eux
hmm, this chart animation progress can -1% ?, but great tutorial anyway
Sergiu
Ok, you convinced me. I will start learning to work with the canvas.
guillaume
Hi ! Like this one !
Is there a way to make it smaller ? When I change canvas h & w to 100 it just hides but is not smaller why ?
Mara
Nice tutorial! Thanks.
Can we use gradient colour in the var color?
Thanks
Jill
Fucking math
Mehedi
Its a awesome work…. fully impressed…
Ernesto
How can I make it read live data? For example, a goggle spreadsheet or a MS SQL database?
Addison
I’ve been checking out your site and there’s some great stuff here and the design isn’t either.
Brandon Aaskov
I’ve been totally stealing this and making an Angular directive out of it. Thanks again for a great intro to the Canvas API :) https://github.com/brandonaaskov/angular-radial
Alex
Thanks for the great tutorial! You can vertically and horizontally center text on canvas by setting “ctx.textAlign = ‘center’” and “ctx.textBaseline = ‘middle’”, then just fillText in the center of the canvas. Thanks again!
Sriram Vellanki
Can we place separators just like clock i.e. 12, 3, 6, 9. I want a visual indicator i.e. a line between 100% & 75%, 75% & 50%, 50% & 25%.
Please let me know how to do it.
Guillermo
How do I connect this wheel to real values like data base that changes constantly?
Bineeta
How do refresh to real values like data base that changes constantly?
Retik Singh
How can we make this suitable for loading a webpage
Please Let me know